
An AdiOS analysis of public data. September 2026.
A buyer in Munich does not buy your capacity. The buyer buys a promise. The right part, at the agreed quality, on the agreed date, with a credible answer when something goes wrong. Everything else on the supplier scorecard is a way of testing that promise.
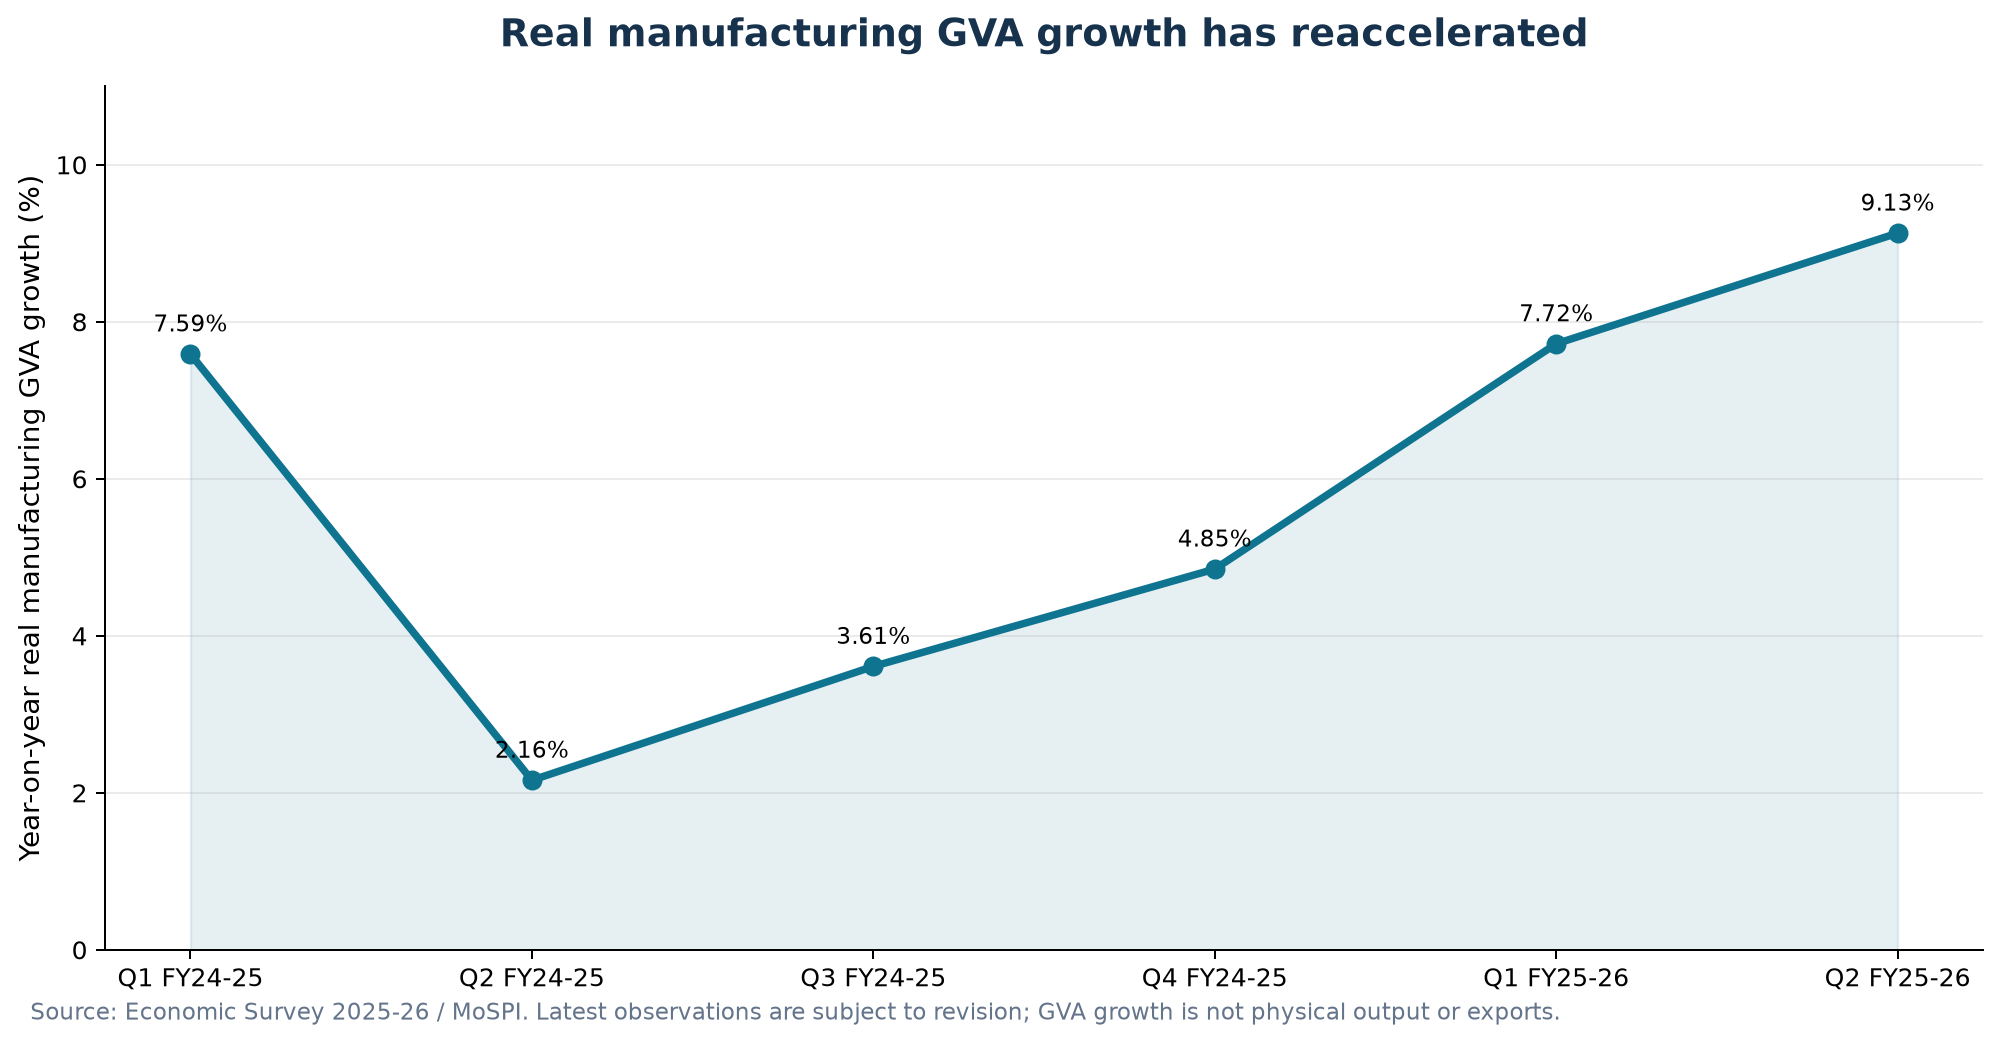
India has never had a better moment to make that promise. Real manufacturing gross value added grew 7.72 percent year on year in the first quarter of FY2025-26 and 9.13 percent in the second. Medium and high-technology activities now make up 46.3 percent of manufacturing value added.1 The factories are being built. The orders are arriving.
The harder question is what happens after the first order. Industrial buyers renew with suppliers who perform the same way every month. They leave suppliers who perform brilliantly once. That gap between growth and dependable performance is the subject of this post. We call it the reliability advantage. It is not a software category. It is an enterprise capability. And it is the capability that decides how much of India's manufacturing moment becomes repeat business.
Scale opens the door
The registered factory sector is already large. The Annual Survey of Industries for 2022-23 counted 253,334 factories, 206,523 of them in operation, employing 18.49 million people.2 That survey covers the formal factory base only. Much of India's unregistered manufacturing sits outside it. Read it as the floor, not the ceiling.
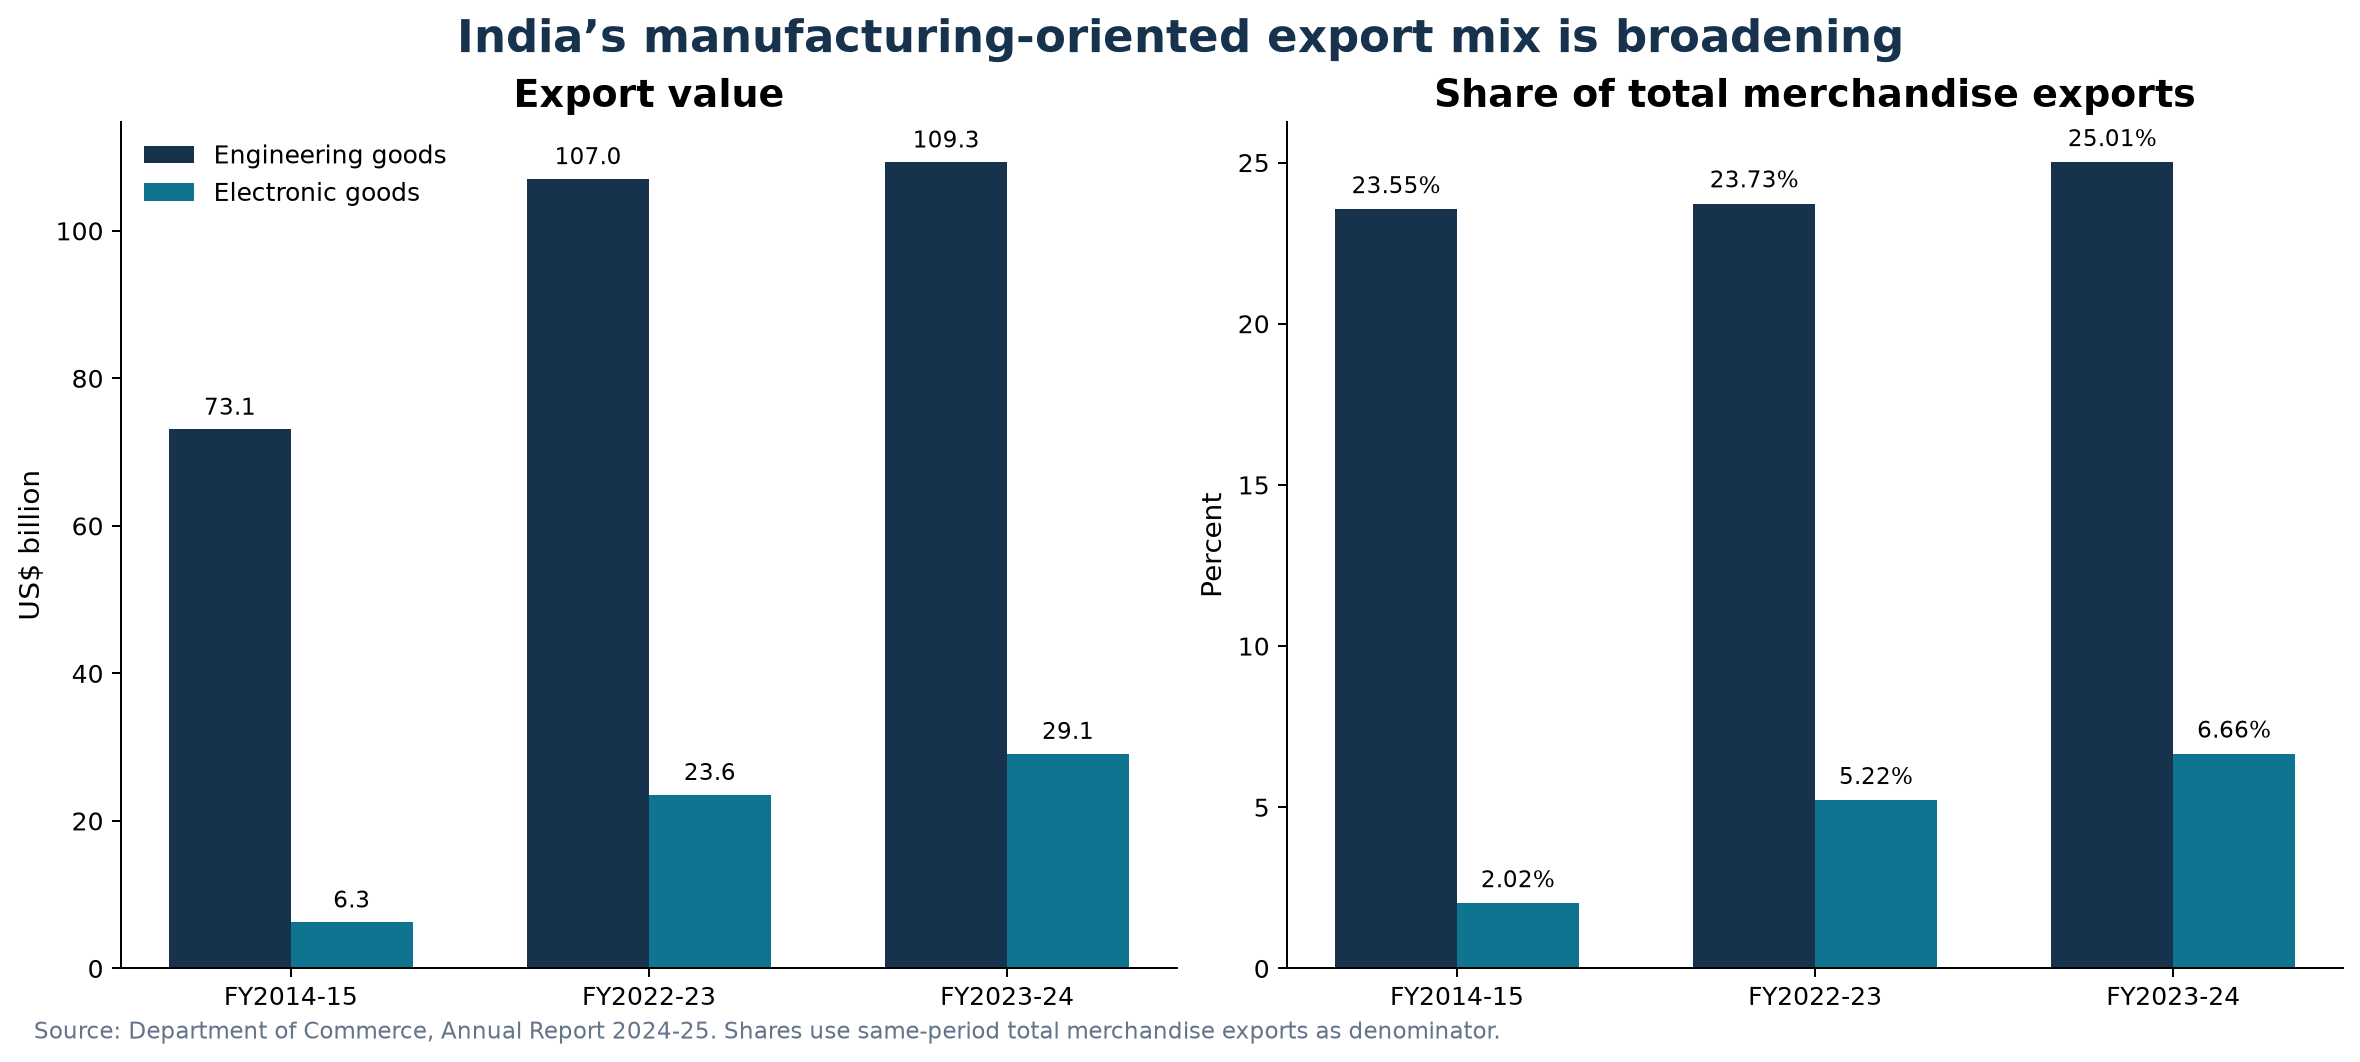
The export mix is broadening. Engineering-goods exports rose from 73.07 billion dollars in FY2014-15 to 109.30 billion dollars in FY2023-24. Electronics exports rose from 6.26 billion to 29.12 billion dollars over the same period, and their share of total merchandise exports climbed from 2.02 percent to 6.66 percent.3 Total FDI inflow reached 80.6 billion dollars in FY2024-25, up from 71.3 billion the year before.4 That is an economy-wide figure, not a manufacturing-only one, but it signals where global capital is looking.
India's international footprint still has headroom. The Economic Survey puts India at an estimated 2.9 percent of global manufacturing value added and 1.8 percent of global merchandise exports in 2024.1 Those two numbers use different denominators. Do not read them as one share. Read them as one strategic fact: India can take a much larger role in global value chains than it holds today.
So the conclusion is not that India lacks scale. Scale creates the opportunity. Reliability decides how much of it converts.
What the buyer has been through
To understand why buyers now ask about reliability before price, look at the last five years from their side of the table.
In McKinsey's 2024 survey of senior supply chain executives, nine in ten respondents reported supply chain challenges during the year. Once disrupted, companies took about two weeks on average to plan and execute a response. Their normal sales-and-operations cycle runs weekly.5 Two weeks of scrambling against a one-week planning rhythm is a structural mismatch. Buyers felt it.
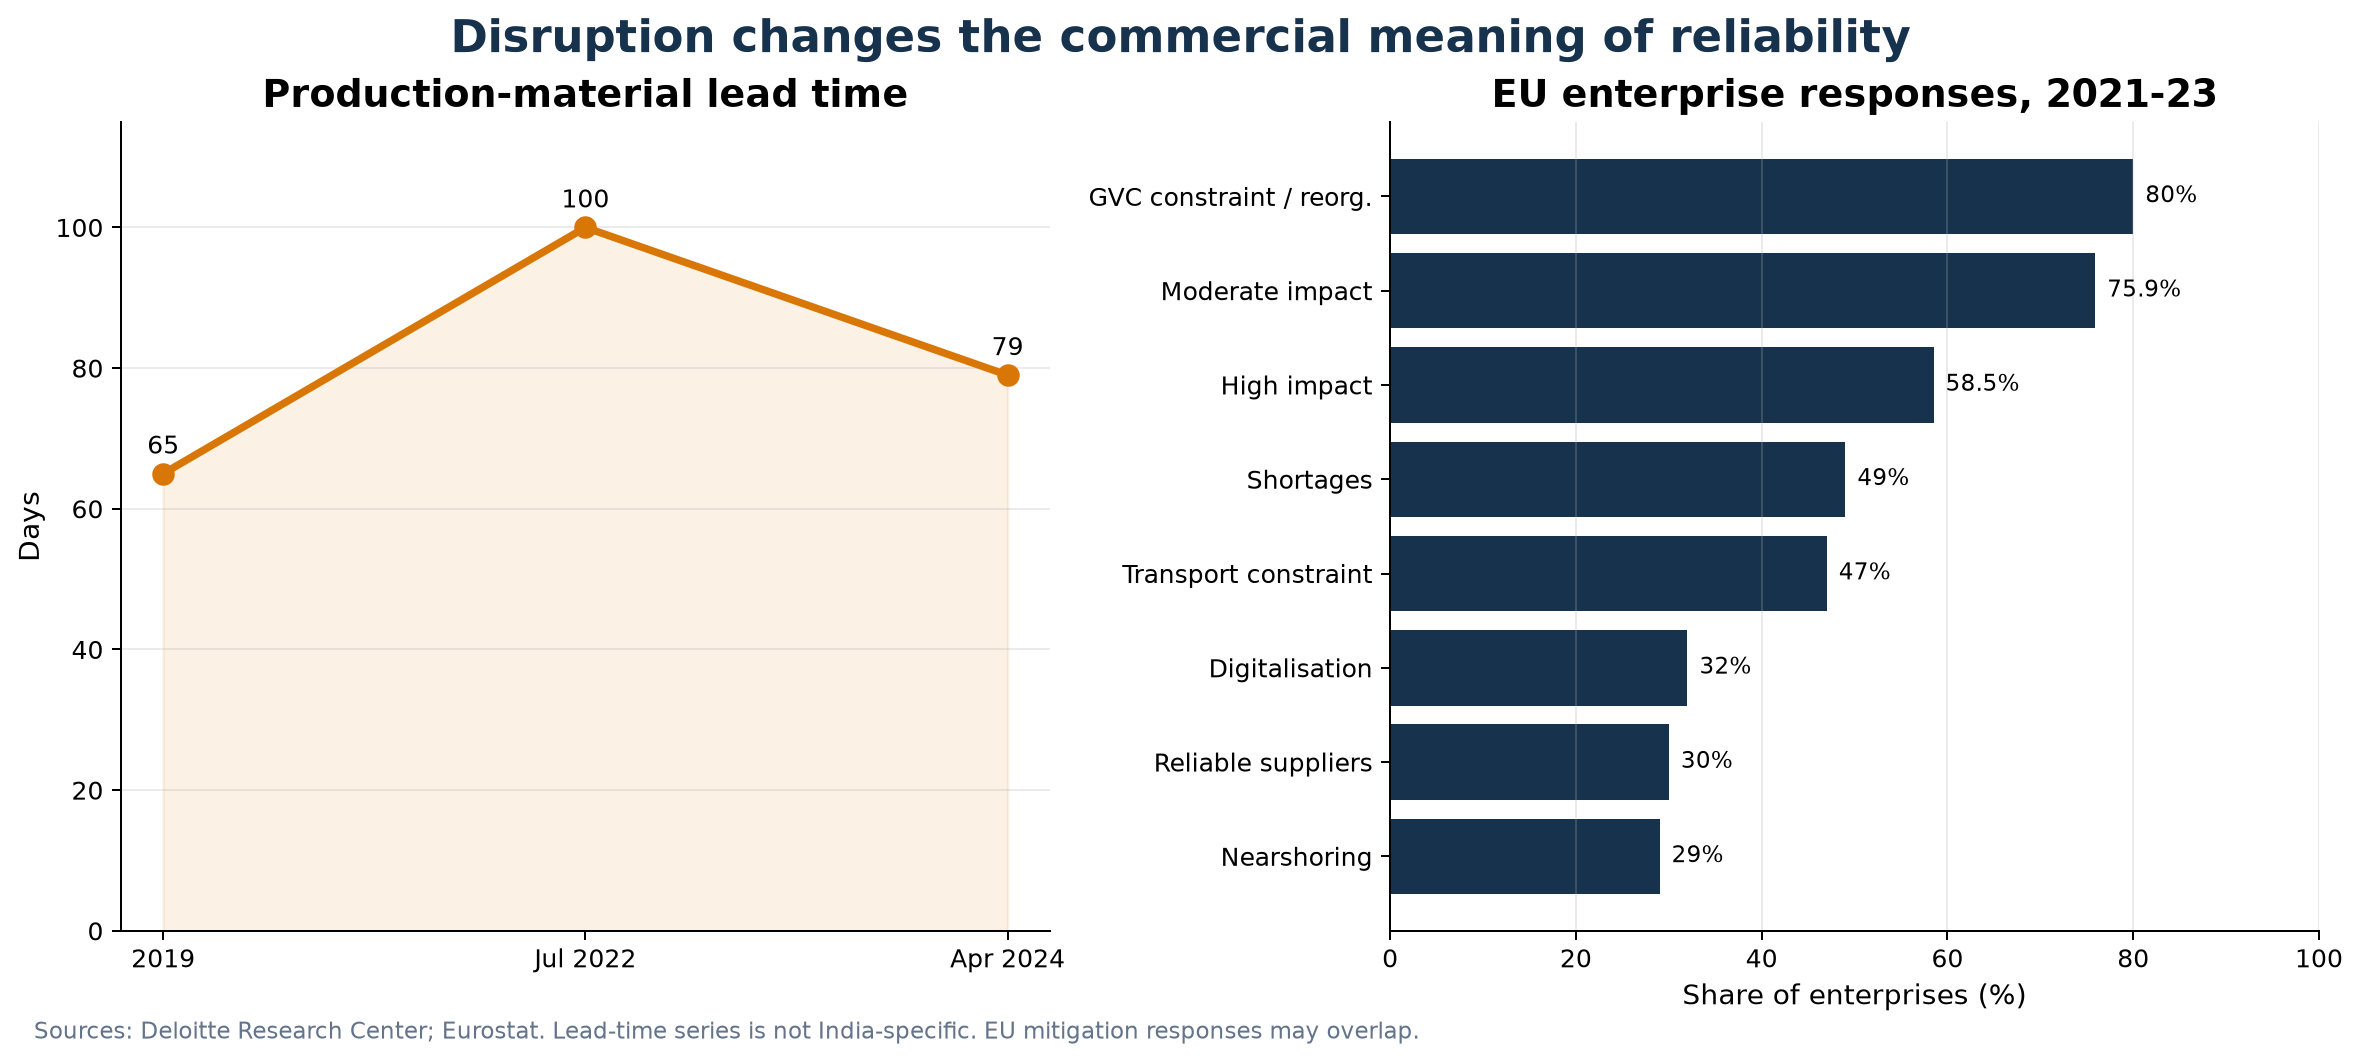
Deloitte's research shows how far the operating environment moved. Average production-material lead time was about 65 days in 2019. It hit 100 days in July 2022. By April 2024 it had eased to 79 days, still well above the old baseline.6 The series is global, not Indian, and it is not the same thing as on-time-in-full delivery. But it shows something important. Disruption resets the environment, and the reset does not fully unwind after the peak.
Then the damage reaches the customer relationship. The Business Continuity Institute's 2023 report recorded the impacts firms attributed to disruption: loss of revenue at 77.6 percent of respondents, loss of productivity at 76.4 percent, customer complaints at 73.8 percent, and stakeholder or shareholder concern at 73.7 percent.7 These are survey shares, not shares of revenue lost. The pattern is what matters. Disruption does not stay in logistics. It reaches the customer and the boardroom.
Buyers responded by changing how they choose. Eurostat's survey across 23 EU countries found that 80 percent of enterprises hit global value chain constraints or reorganised their chains between 2021 and 2023. Almost half reported shortages. Nearly as many reported transport constraints. And 30 percent said they now concentrate on their most reliable suppliers.8
That last number is the one an Indian plant should tape to the wall. Reliability has become a qualification. A supplier who can show stable process capability, a credible recovery time, traceable data and closed corrective actions is easier to trust than one who offers only a low nominal price and installed capacity.
India's logistics signal is real. It is not a plant KPI
India's position in the World Bank Logistics Performance Index improved to 38th in 2023, from 44th in 2018 and 35th in 2016.9 In the World Bank's updated dataset the 2023 overall score was 3.4 on a scale of 1 to 5. Timeliness scored 3.6. International shipments and logistics competence scored 3.5. Infrastructure scored 3.2 and customs 3.0.10
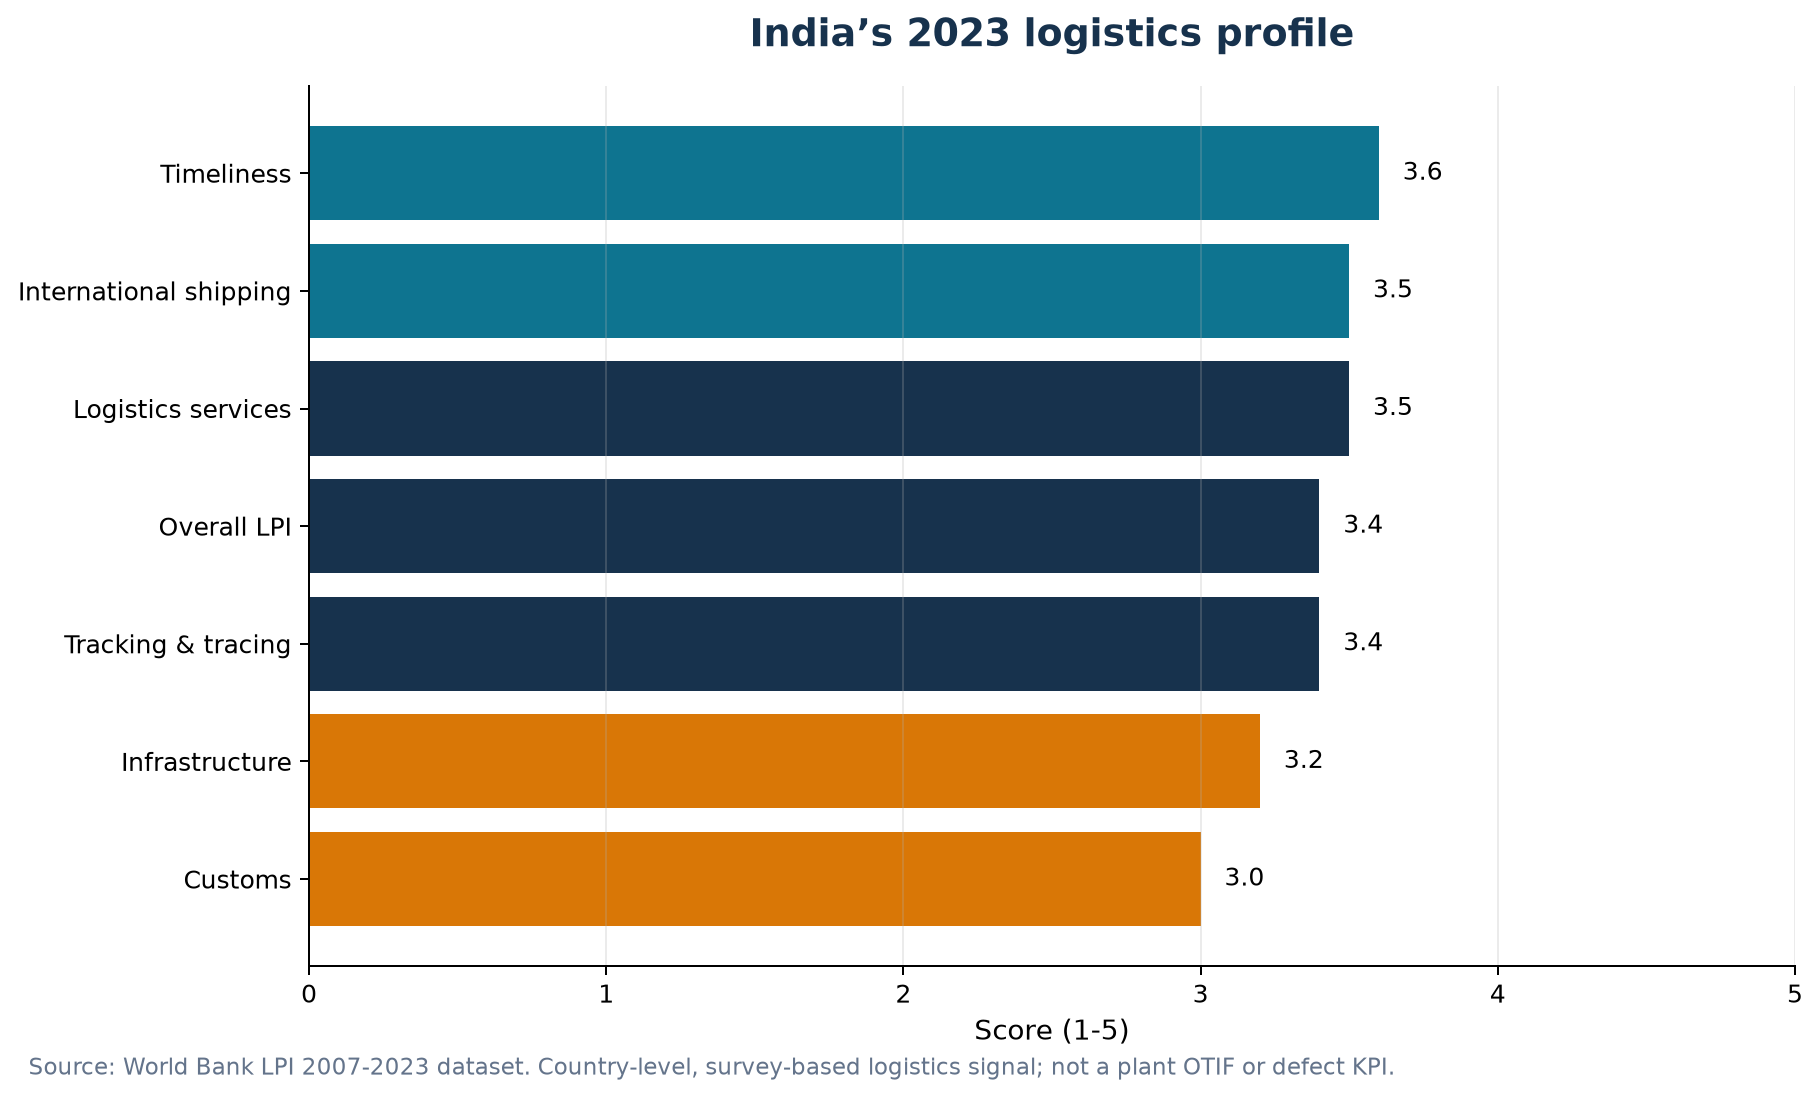
This is good news, read correctly. The index is built from the assessments of freight forwarders and express carriers. It measures the country's logistics environment. It does not measure a factory's on-time-in-full rate, first-pass yield, supplier failure rate, warranty returns or mean time to recovery.
That distinction matters for anyone selling from India. The reviewed sources do not establish a current official India-wide series for plant-level OTIF, defect-free delivery or warranty returns. A country can improve its ports and corridors while individual plants still differ widely in quality discipline, maintenance maturity, supplier control and schedule adherence. The honest claim is this: India's logistics environment is improving, and the reliability of any specific manufacturing network still has to be proven by its own operating data.
Buyers know this. That is why they audit the plant, not the country.
Reliability is an operating system, not a purchase
The evidence supports an integrated operating model. Not a technology-only story.
Start with quality. First-pass yield measures the share of units that complete a process without rework, repair or rejection on the first attempt.11 Defective parts per million measures nonconforming parts against parts inspected. Defects per million opportunities uses a different denominator, and the two should never be swapped in a customer report.12 Quality management reduces the probability that variation reaches the customer.
Then assets. NIST's analysis of maintenance practice found that manufacturers in the lower half by reactive-maintenance spending had 52.7 percent less unplanned downtime and 78.5 percent fewer defects than the upper half. Within that lower-reactive group, plants leaning on predictive rather than preventive maintenance had 18.5 percent less unplanned downtime and 87.3 percent fewer defects.13 This is survey analysis, not a controlled trial. Plants that invest in predictive maintenance may also have better leadership, newer assets and stronger process control. Read it as a strong association, not a law.
Then data. Deloitte's 2025 survey of 600 executives reported average net gains of 10 to 20 percent in production output, 7 to 20 percent in employee productivity and 10 to 15 percent in unlocked capacity after smart manufacturing programmes.14 Self-reported, not audited. But the mechanism is plain. Connected data shortens the distance between detection and action.
Put the mechanism together and it reads like a system, because it is one. Standard work and quality control drive first-pass yield and the cost of poor quality. Condition monitoring and maintenance discipline drive failure exposure and recovery speed. Planning and fulfilment discipline drive schedule attainment and on-time-in-full. Skilled frontline teams decide whether any of it works on a Tuesday night shift.
Indian plants have already proven it is possible
Two Indian sites in the World Economic Forum's Global Lighthouse Network show what the operating model looks like when it runs.
CEAT's Sriperumbudur tyre plant deployed more than 30 digital solutions, including operational research models for turnaround time and predictive control. The WEF reports 25 percent higher labour productivity, 54 percent lower dispatch turnaround time, 30 percent faster product ramp-up and 47 percent lower Scope 1 and 2 emissions.15
Unilever's Tinsukia site, in a remote region with limited resources, implemented over 50 digital use cases. Its planning frozen period fell from 14 days to one day, which enabled a threefold increase in unique SKUs.15
These cases matter because they are Indian and because they are real. They are not national benchmarks. Lighthouse sites are selected because they are advanced. The public case material does not consistently disclose baselines, absolute denominators or counterfactuals. Use them as proof of feasibility. Do not use them to imply that the average Indian factory performs this way today. The gap between the Lighthouse and the median plant is exactly the reliability advantage waiting to be built.
People, safety, energy and materials are reliability capabilities too
A buyer's audit no longer stops at the line. It covers the workforce, the safety record, the energy exposure and the material footprint. Each of these is a reliability question in disguise.
Skills first. The World Bank reports that the Skill India Mission Operation trained almost 6 million people between 2018 and 2022. Thirty-four percent were women. Forty percent found wage employment within six months.16 That is real training scale, though not a manufacturing-only employability rate.
The automotive data show why capability has to be examined by occupation. In 2022-23, workers with no technical education made up 53 percent of motor-vehicle manufacturing workers, 57 percent of parts-and-accessories workers and 93 percent of repair-and-maintenance workers.17
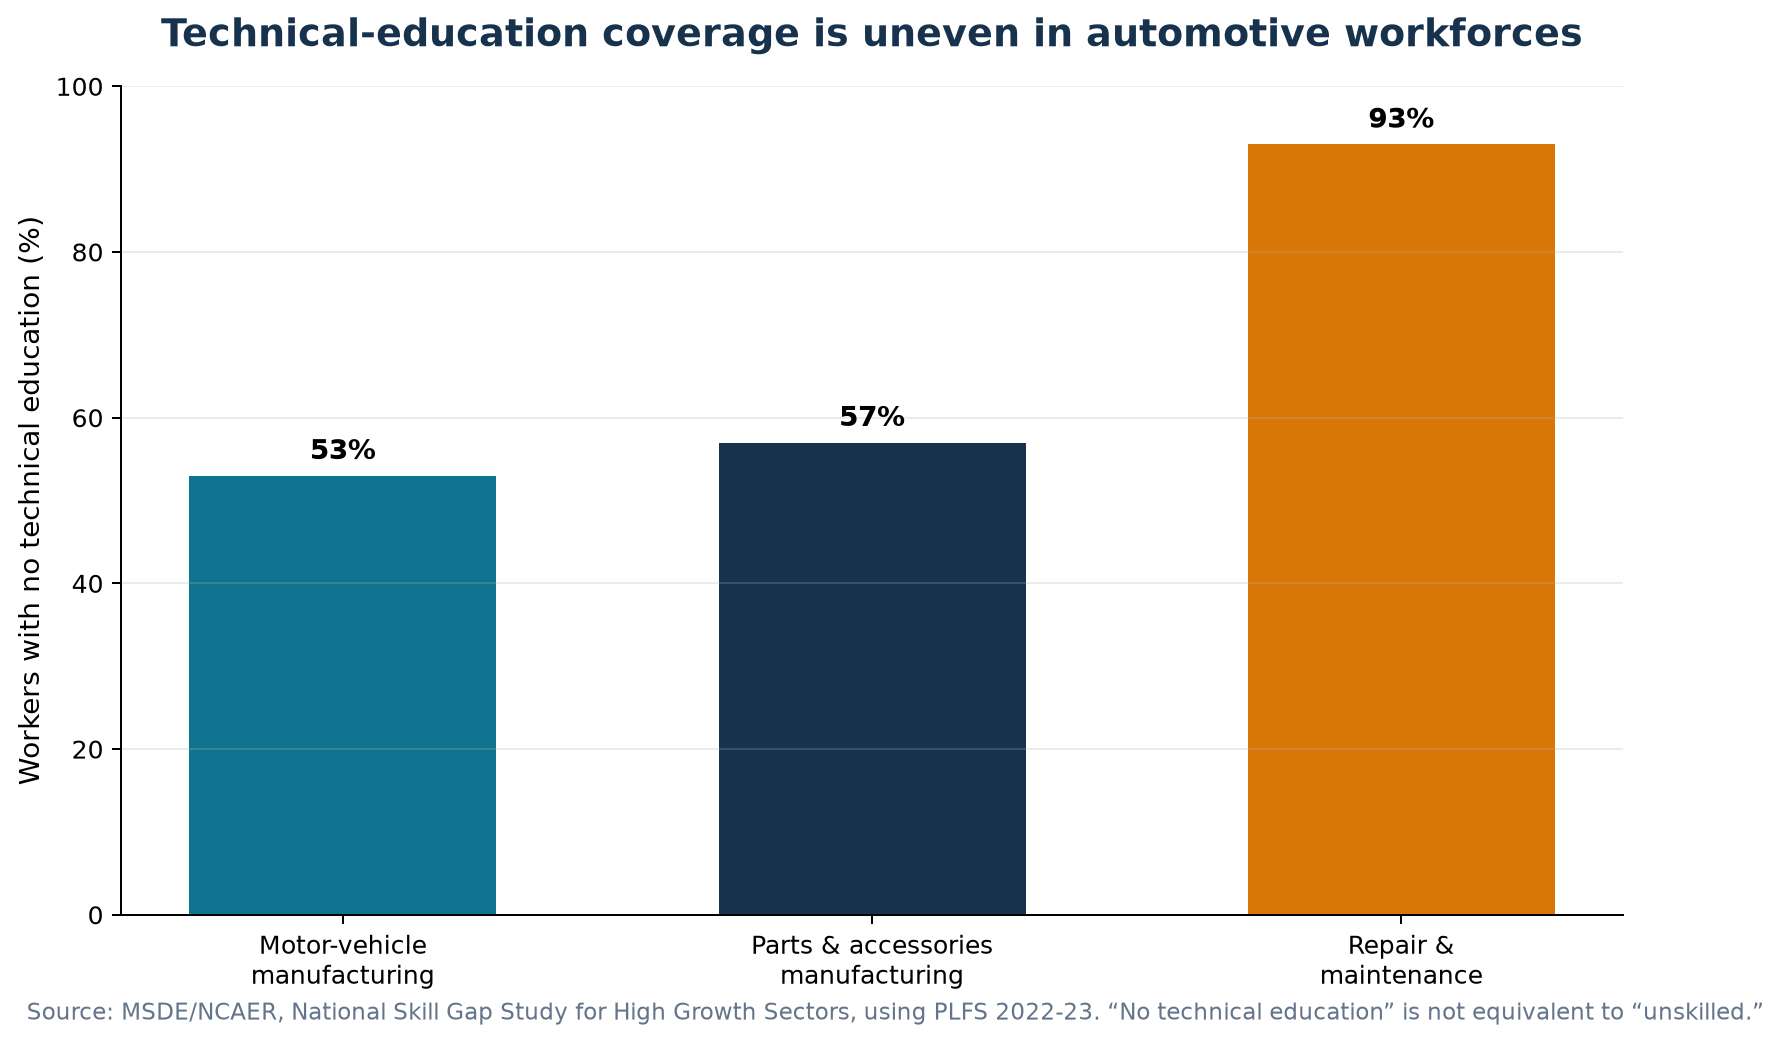
"No technical education" does not mean unskilled. The measure misses most on-the-job learning, and the study notes its own mapping limits. The useful implication is narrower. A manufacturer needs to know which skills are certified, which are learned on the floor, and which are essential for quality, maintenance, safety and digital work instructions. A buyer will ask.
Safety sits in the same system. Labour Bureau factory returns recorded 661 fatal injuries, 1,879 non-fatal injuries and 2,540 total injuries in 2019, with an all-injury frequency rate of 0.12 per 100,000 man-days worked.18 Coverage varies by state and reporting is incomplete, so treat this as reported factory-return data, not the full national burden.
Energy creates another boundary. The IEA reports India's energy-related emissions at 2,763 million tonnes of CO2 in 2023, with coal at 46 percent of total energy supply.19 In 2024 energy-related emissions rose 5.3 percent and electricity demand rose 5 percent. Heatwave-driven cooling demand alone added an estimated 50 million tonnes, about a third of the year's increase.20 These are economy-wide numbers. They still matter to a plant because heat, grid volatility, carbon requirements and fuel exposure affect continuity, cost and customer qualification.
Materials are tightening as well. An Economic Advisory Council to the Prime Minister working paper puts India's annual material consumption at 1.18 billion tonnes in 1970, 7 billion tonnes in 2015, and a projected 14.2 billion tonnes by 2030. The same paper cites over 62 million tonnes of waste a year, projected to reach 165 million tonnes by 2030.21
The strategic point is direct. A reliable supplier operates through skill shortages, safety risk, energy volatility and material constraints. Sustainability is not a separate communications layer. It is part of operational continuity, and buyers score it that way.
The metric tree: from customer promise to cash
A reliability programme becomes credible when its measures have fixed definitions, auditable denominators, named owners and a line to financial value. This tree is a practical architecture, not a universal benchmark.
| Layer | Core measures | The executive question |
|---|---|---|
| Customer promise | OTIF | Did the customer receive the complete order inside the agreed window? |
| Planning and fulfilment | Schedule attainment, supplier on-time delivery | Did the network execute the plan and receive inputs as promised? |
| Process quality | FPY, DPPM or DPMO, customer defects | How much good product was made without rework or escape? |
| Equipment | OEE, MTBF, MTTR | Was capacity available, effective and recoverable? |
| Financial value | COPQ, avoided disruption cost, NPV, payback | Did reliability protect margin, cash and customer value? |
OTIF is the share of orders delivered both complete and on time. APQC reports a cross-industry median of 90 percent across 1,781 companies. There is no India-specific or manufacturing-only public target.22
Overall equipment effectiveness is availability times performance times quality. A Tennessee MEP worked example gives 75.4 percent OEE from 86.7 percent availability, 89.7 percent performance and 97.0 percent quality.23 That is an illustration, not a threshold.
Mean time between failures is operating time divided by failures. Mean time to repair is downtime divided by failures.24 Their value lies in the decisions they trigger: which failure modes to eliminate, which spares to hold, which maintenance tasks to redesign, which recovery routines to standardise.
Quality needs a financial bridge. The American Society for Quality defines the cost of poor quality as the cost of internal failures before the customer receives the product plus external failures after.25 Count scrap, rework, sorting, warranty, returns, expedite freight, lost capacity and customer recovery. Not only what the quality department books.
Manage the tree as a system. Better OEE with more inventory and more complaints is not a reliability gain. Better first-pass yield with missed delivery dates is not enough. Lower maintenance cost from deferred work is a loan against future downtime. Reliability is the joint outcome of quality, delivery, assets, people, suppliers, energy and risk.
What an Indian manufacturing leader should prove
The credible agenda is not a promise that one technology will transform the plant. It is a sequence of proof.
- Fix the customer promise first. Define OTIF by order or order line. Agree the window. Record how partial shipments and customer-requested changes are treated. Without this, two plants can report the same number and measure different realities.
- Connect the promise to its drivers. FPY and DPPM or DPMO for quality. OEE, MTBF and MTTR for equipment. Schedule attainment and supplier delivery for planning. Give every measure an owner and review it at the cadence of the decisions it controls.
- Make the evidence auditable. Keep timestamps, genealogy, changeover history, work orders, downtime reason codes, inspection results and corrective-action closure. AI finds patterns in this record. It cannot repair inconsistent definitions or fill missing data.
- Publish a measured scorecard. Report the result and the denominator. Separate actual performance from scenario projections. Separate a Lighthouse case from a national statistic. Say whether each number is observed, surveyed, modelled, estimated or company-reported.
Do these four things and the buyer's audit stops being a risk. It becomes your sales deck.
Why we built an operating system for this
Step three is where most reliability programmes stall. The evidence exists on the floor. It lives in a historian, a maintenance system, an inspection camera, a spreadsheet and three people's memory. Every audit reassembles it by hand. Every plant does it differently. And when a pattern is finally understood at one site, it stays there.
That is the problem AdiOS was designed around. The Circular Operating System treats the plant's evidence as a first-class asset of the institution. Observations are captured where production happens, scored, promoted through confidence tiers as engineers validate them, and compounded into an organisational brain that every plant can draw on. Raw production data never leaves the plant. Validated patterns do. A motor failure signature learned in one plant becomes advance warning in the next.
Two properties matter for a factory. The plant runs at full capability when the wide-area link is down, because the sync layer is offline-first by design. And every quality decision, batch release and corrective action carries a signed lineage, so the audit trail is generated as a by-product of operating, not assembled before the customer visit. Compliance sits in the operating system, not in a plugin.
We do not claim this makes a plant reliable. Discipline makes a plant reliable. What an operating system can do is make the discipline cheaper to sustain, harder to lose, and easier to prove. Intelligence that compounds inside the institution that generates it is the mechanism. Reliability is the outcome a buyer can see.
From capacity to confidence
India's manufacturing growth is real. Its export mix is broadening, capital is arriving, technology intensity is rising, and its global footprint has room to expand. The next competitive step is not simply more capacity. It is dependable performance across plants, suppliers, people, assets and customer commitments.
That is the reliability advantage. It gives a global buyer a reason to choose, renew and expand with an Indian supplier. Not because reliability was asserted. Because it was demonstrated, month after month, in repeatable quality, predictable delivery, fast recovery, skilled work, responsible resource use and transparent evidence.
The next advantage belongs to the manufacturers who make reliability measurable, repeatable and trusted.
If you run plants and want to see what a reliability evidence layer looks like on your own floor, talk to us.
References
- Government of India (2026). Economic Survey 2025-26, Chapter 8: Industry's Next Leap.
- MoSPI (2025). Annual Survey of Industries 2022-23, Volume I.
- Department of Commerce (2025). Annual Report 2024-25.
- DPIIT (2025). FDI Fact Sheet, updated June 2025.
- McKinsey & Company (2024). Global Supply Chain Leader Survey 2024.
- Deloitte (2024). Supply chain resilience amid disruptions.
- Business Continuity Institute (2023). Supply Chain Resilience Report 2023.
- Eurostat (2024). Global value chain disruptions and enterprise responses in the EU.
- World Bank (2024). India Country Economic Memorandum 2024.
- World Bank (2023). Survey-based Logistics Performance Index 2007 to 2023.
- ASQ India. First pass yield: definition, meaning and application.
- ASQ Ask the Experts (2017). Defective parts per million calculation and DPMO.
- NIST (2018). Maintenance Costs and Advanced Maintenance Techniques in Manufacturing Machinery: Survey and Analysis.
- Deloitte (2025). 2025 Smart Manufacturing and Operations Survey.
- World Economic Forum (2025). Global Lighthouse Network: The Mindset Shifts Driving Impact and Scale in Digital Transformation.
- World Bank (2023). Helping India Build a Skilled, Inclusive Workforce for the Future.
- MSDE / NCAER (2025). National Skill Gap Study for High Growth Sectors.
- Labour Bureau (2019). Report on Statistics of Factories 2019.
- International Energy Agency. India country profile.
- International Energy Agency (2025). Global Energy Review 2025: CO2 Emissions.
- Economic Advisory Council to the Prime Minister (2023). India's Tryst with a Circular Economy.
- APQC. Percentage of orders delivered complete and on time.
- Tennessee MEP. OEE Implementation Guide.
- NIST/SEMATECH. e-Handbook of Statistical Methods: MTBF.
- American Society for Quality. Cost of Quality.